Concrete is one of the most widely used man-made materials. But its main component, cement, is associated with approximately 7% of global CO₂ emissions. Global emissions from the cement and concrete sector exceed 2.5 billion tons of CO₂ per year.
Urbanization continues, the population is growing, and demand for housing and construction materials is increasing. This raises the question: how can we build more while using less carbon? Cement is acquiring a new characteristic — its carbon footprint. It is gradually becoming as economically significant as price and strength.
Article structure:
-
Why cement is associated with high CO₂ emissions
-
Why clinker is the key factor
-
How CBAM turns emissions into an economic cost
-
What data CBAM requires from a cement producer
-
Simplified example: the CBAM cost of clinker emissions
-
Full CBAM model calculation for 300,000 tons of cement
-
How the cost will change through 2034
-
Which technologies can reduce this cost
-
Financing decarbonization projects — CIF
-
What this means for Uzbekistan’s cement industry
1. Why is cement associated with high CO₂ emissions?
CO₂ is generated twice during cement production:
-
Source No. 1 — fuel — a huge kiln must be heated.
-
Source No. 2 — the limestone itself — when heated, calcium carbonate chemically decomposes and releases CO₂.
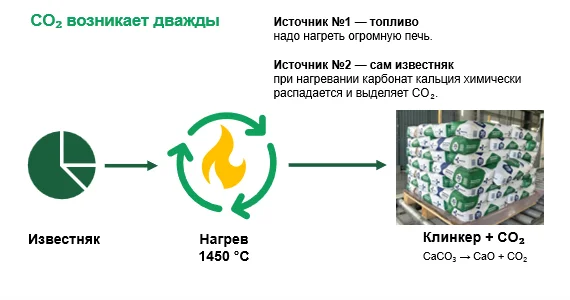
About 60% of direct emissions from cement production are associated with the chemical decomposition of carbonates, while about 40% result from fuel combustion and maintaining the required process temperature. Carbon-footprint and CBAM calculations additionally account for indirect emissions, primarily those associated with consumed electricity. Even if a cement plant switches entirely to renewable electricity, process-related (chemical) emissions from limestone will not disappear.
2. Why is clinker the key factor in CO₂ emissions?
-
Conventional Portland cement contains up to approximately 80–95% clinker
-
Innovative LC3 contains about 50% clinker.
Innovative technologies such as LC3 do not attempt to capture CO₂ after it has been created. By optimizing the process, they prevent a substantial share of these emissions from being generated in the first place.
What technologists call the clinker factor has already been turned by the CBAM carbon-border regulator into an economically significant product indicator.
“For cement, the ratio of clinker mass to cement mass — the clinker-to-cement ratio, or clinker factor — must be taken into account,” according to the CBAM methodology.
3. How CBAM turns emissions into an economic cost
The definitive phase of CBAM has applied since January 1, 2026. The EU requires importers of certain carbon-intensive goods to account for the products’ embedded emissions and purchase the corresponding number of CBAM certificates. The certificate price is linked to the carbon price in the European Union Emissions Trading System — EU ETS.
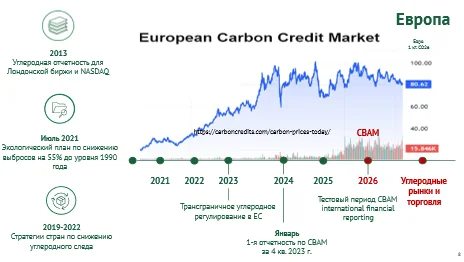
Uzbekistan is developing its own regulatory framework and policy, which is aligning with international markets and creating opportunities to participate in the international carbon-unit market. This, in turn, is an important economic mechanism.
-
Previously, the cement price consisted of: production cost + logistics
-
Now: production cost + logistics + carbon footprint
4. What data CBAM requires from a cement producer
CBAM looks not only at the plant. It looks inside the product. For cement, the relevant precursors are taken into account — primarily clinker and calcined clay, if used. One very important detail is that the producer must provide information about the share of clinker in the cement. In the cement industry, CBAM covers, among other things:
-
calcined clay — CN code 2507 00 80;
-
cement clinker — CN 2523 10 00;
-
white Portland cement;
-
other Portland cement;
-
other hydraulic cements;
-
aluminous cement.
CBAM seeks to understand four things in order to obtain the indicator: tons of CO₂ per ton of product.
-
How much CO₂ is generated directly at the plant. Fuel + chemical processes.
-
How much electricity production consumes and what its carbon intensity is.
-
Which carbon-intensive materials went into the product. Clinker and calcined clay are especially important for cement.
-
How much finished product was produced
What is the cost of CBAM obligations when importing cement into the EU, and how is it calculated?
Carbon allowance exchange ECA. On August 17, 2026, the market price of EU ETS emission allowances (EUAs) was approximately €81.83/t CO₂. This example uses that figure as an illustrative market reference. The official price of CBAM certificates is determined by the European Commission: quarterly in 2026 and weekly from 2027.
For gray cement clinker, the CBAM benchmark established by Implementing Regulation (EU) 2025/2620 in force for 2026 is 0.666 t CO₂e per ton of clinker. For white clinker, it is 0.859 t CO₂e/t.
However, in 2026, 97.5% free coverage under this benchmark is still retained. The European Commission expressly specifies a CBAM factor of 97.5% for 2026, after which it gradually decreases to zero by 2034.
5. Simplified CBAM calculation example: the cost of clinker emissions
Important: this calculation shows only the effect of clinker emissions and is used to explain the mechanism. It is not a full CBAM calculation for finished cement. The full calculation is provided below.
1. Determine the chargeable share of clinker emissions
Actual clinker emissions: 0.82 t CO₂/t clinker. The 2026 CBAM benchmark reference, taking into account the retained free share: 0.666 × 97.5% = 0.649 t CO₂/t clinker
Therefore:

2. Calculate the carbon cost of 1 ton of clinker
At a carbon price of: €81.83/t CO₂

3. Convert the cost to 1 ton of cement
If 1 ton of cement contains 0.80–0.95 t of clinker, then:

Where K is the clinker factor.
-
At 80% clinker: 14×0.80=€11.2/t cement
-
At 95% clinker: 14×0.95=€13.3/t cement
4. Calculate the cost for a batch of 300,000 tons of cement

-
At an 80% clinker factor: 300000×11.2=€3,360,000
-
At a 95% clinker factor: 300000×13.3=€3,990,000
Result
Batch: 300,000 t of cement. Estimated CBAM carbon cost of the clinker share: approximately €3.36–3.99 million
under the following assumptions:
0.82 t CO₂/t clinker — actual emissions
0.649 t CO₂/t — benchmark taking into account the free share in 2026
€81.83/t CO₂ — carbon price used
80–95% — share of clinker in cement
Universal formula for calculating the CBAM carbon cost of clinker for cement

where:
Mcement — mass of cement, t
K — share of clinker in cement
Efact — actual clinker emissions, t CO₂/t
Ebenchmark — applicable benchmark, t CO₂/t
PCO₂ — carbon price, €/t CO₂
A simplified example for illustration. The actual CBAM obligation is calculated taking into account the specific good, embedded emissions, the CBAM benchmark, free allocation adjustment, and any carbon price already paid in the country of origin.
Free coverage is gradually being reduced. Under the EU schedule, the CBAM factor is 97.5% in 2026, 90% in 2028, 51.5% in 2030, and 0% from 2034. Consequently, reducing the clinker factor ceases to be solely an environmental measure and becomes a way to reduce future carbon costs. This is where it is important to begin studying and implementing innovative technologies.
The calculation shows only the effect of clinker’s carbon intensity. A full calculation of cement’s embedded emissions under CBAM also includes indirect emissions and other parameters provided for by the methodology.
For cement under the definitive CBAM regime from 2026, the situation is broader: cement is not included in the list of goods for which only direct emissions are counted; therefore, both direct and indirect embedded emissions are counted for cement. Indirect emissions are primarily emissions from the electricity consumed in the production process. For finished-cement production, the electricity used for grinding, preparing, and processing materials is accounted for separately; the relevant precursors are clinker and calcined clay.

Put simply:
1 t of cement = clinker emissions + calcined-clay emissions, if any + fuel used in cement production + electricity used for cement production/grinding.
This is precisely why CBAM calls cement a complex good: its embedded emissions include the emissions of the relevant precursors.
Important: from 2026, CBAM accounts for both direct and indirect embedded emissions for cement. The European Commission’s new methodology dated August 14, 2026 expressly states that indirect emissions are included for cement-sector goods; these are emissions from generating the electricity consumed during production. Moreover, the functional unit for cement is now linked to the tons of clinker contained in the product, because clinker content determines a significant share of emissions.
6. Full CBAM model calculation for 300,000 t of cement: a practical example.
Consider a batch of 300,000 t of ordinary Portland cement and the following assumptions:
|
Parameter |
Assumption |
|
Cement batch |
300 000 t |
|
Clinker factor |
90% |
|
Quantity of clinker |
270 000 t |
|
Direct clinker emissions |
0.82 t CO₂/t clinker |
|
Total production electricity consumption |
100 kWh/t cement |
|
0.519 kg CO₂/kWh |
|
|
Additional direct emissions from grinding/drying |
5 kg CO₂/t cement |
|
Carbon price |
€81.83/t CO₂ |
|
Gray-clinker benchmark |
0.666 t CO₂/t clinker |
|
2026 CBAM factor |
97.5% |
1. Direct clinker emissions
0.82×0.90=0.738 tCO₂/t cement, or: 738 kg CO₂/t cement. Add the assumed additional direct emissions from cement production: 738+5=743 kgCO₂/t
2. Indirect emissions from electricity
100 kWh/t×0.519 kgCO₂/kWh = 51.9 kgCO₂/t cement. For a batch of 300,000 t: 300,000×0.0519 = 15,570 tCO₂
3. Total embedded emissions
743+51.9=794.9 kgCO₂/t cement, or: 0.7949 tCO₂/t cement. For the entire batch: 300000×0.7949 = 238,470 tCO₂
4. Free-allocation adjustment in 2026
For gray clinker: 0.666×97.5%=0.64935 tCO₂/t clinker. But our ton of cement contains only 0.90 t of clinker, therefore: 0.64935×0.90=0.584415 tCO₂/t cement
5. Emissions subject to the CBAM obligation
0.7949−0.584415=0.210485 tCO₂/t cement. In other words, approximately 210.5 kg CO₂ per ton of cement remain in our model base for calculating the CBAM cost.
6. Cost per 1 ton of cement
At a price of: €81.83/t CO₂
0.210485×81.83=€17.22/t cement
7. Cost for a batch of 300,000 tons
300,000×17.22= €5,167,196
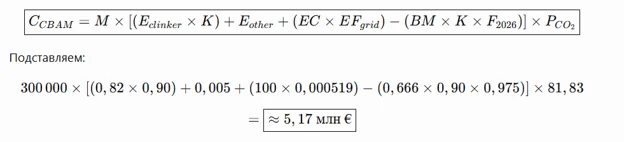
Illustrative calculation. Model values were used for electricity consumption, the electricity emission factor, and additional direct emissions. The actual CBAM calculation is based on verified data from the specific installation, the applicable methodology, the free-allocation adjustment, and the carbon price actually paid in the country of origin.
7. How the cost of CBAM obligations will change through 2034
In 2026, the CBAM mechanism still accounts for a significant share of EU ETS free allocation. However, this adjustment will gradually decrease and disappear completely by 2034. This is why, even with unchanged production technology and unchanged actual carbon intensity of cement, the financial burden under CBAM will increase. The European Commission expressly provides for the gradual introduction of CBAM in step with the phase-out of free EU ETS allowances over 2026–2034.
Take the full model-calculation parameters from the previous section:
-
cement batch — 300,000 t;
-
clinker factor — 90%;
-
total embedded emissions — 0.7949 t CO₂/t cement;
-
gray-clinker benchmark — 0.666 t CO₂/t clinker;
-
all production-process parameters remain unchanged.
The change in cost will then be as follows:
|
Year |
Retained free share |
Emissions used in the CBAM calculation, t CO₂/t cement |
At €81.83/t CO₂ |
At €90/t CO₂ |
At €100/t CO₂ |
|
2026 |
97.5% |
0.2105 |
€5.17 million |
€5.68 million |
€6.31 million |
|
2028 |
90% |
0.2554 |
€6.27 million |
€6.90 million |
€7.66 million |
|
2030 |
51.5% |
0.4862 |
€11.94 million |
€13.13 million |
€14.59 million |
|
2034 |
0% |
0.7949 |
€19.51 million |
€21.46 million |
€23.85 million |
This is not a carbon-price forecast, but a scenario calculation: it shows how the same batch of cement, produced using the same technology, will incur an increasingly high carbon cost as free allocation is phased out.
If the carbon price remains at €81.83/t CO₂, the cost of CBAM obligations for a batch of 300,000 t of cement in our model increases to:
2026 — approximately €5.17 million
2028 — approximately €6.27 million
2030 — approximately €11.94 million
2034 — approximately €19.51 million
That is an increase of almost 3.8 times. And if the carbon price reaches €100/t CO₂ by 2034, the cost for the same batch with unchanged technology will approach €23.85 million.
At the same time, the actual price of CBAM certificates is not fixed in advance. In 2026, the European Commission calculates it quarterly as the weighted average price of EU ETS auctions; from 2027, the calculation becomes weekly.
Taking no action also has a cost. If a producer does not reduce the carbon intensity of its products, the gradual phase-out of free coverage turns every additional ton of CO₂ into an increasingly significant factor in cost and competitiveness.
Thus, cement decarbonization now extends far beyond the environmental agenda. It is a matter of technology, production cost, access to export markets, and investment. As the carbon price rises, it becomes more economical for companies to reduce the clinker factor, improve energy efficiency, switch to low-carbon electricity, introduce CO₂ capture, and develop MRV systems.
8. Which technologies can reduce the carbon cost of cement
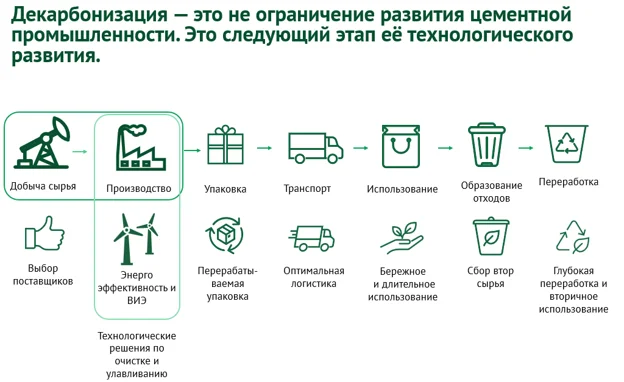
Cement decarbonization cannot be reduced to a single technology. It is a sequential transformation of the entire production process — from energy consumption and cement composition to CO₂ capture and reuse.
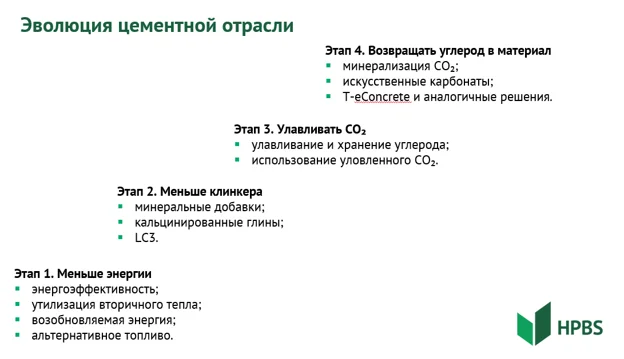
First level — less energy and less carbon in the energy supply
This level includes:
-
improving the energy efficiency of kilns and equipment;
-
waste-heat recovery;
-
modernizing grinding systems;
-
using alternative fuels;
-
using renewable electricity;
-
automating and digitizing energy-consumption management.
These measures primarily reduce emissions associated with fuel and electricity.
However, energy measures alone cannot solve the problem completely: a significant share of CO₂ arises directly from the chemical decomposition of limestone.
Second level — less clinker
Because clinker is the principal carbon-intensive component of cement, reducing the clinker factor is one of the most effective ways to reduce emissions.
Supplementary cementitious materials are used for this purpose:
-
blast-furnace slag;
-
ash;
-
natural pozzolans;
-
calcined clays;
-
limestone.
One example is LC3 technology — cement based on limestone and calcined clay.
LC3 makes it possible to reduce clinker content to approximately 50% and cut CO₂ emissions by up to 40% compared with ordinary Portland cement. At the same time, the technology can be introduced at existing cement plants with relatively limited equipment modifications.
From a CBAM perspective, reducing the clinker factor becomes not only an environmental but also an economic solution because the share of clinker directly affects a product’s embedded emissions.
Third level — capturing the remaining CO₂
After implementing energy efficiency, reducing the clinker factor, and decarbonizing electricity, process emissions remain that are difficult to eliminate technologically.
The next stage therefore involves the following technologies:
-
CCS — CO₂ capture and geological storage;
-
CCU — CO₂ capture and utilization.
These technologies are especially important for the cement industry precisely because process CO₂ arises regardless of the energy source used to heat the kiln.
Fourth level — returning CO₂ to the construction material
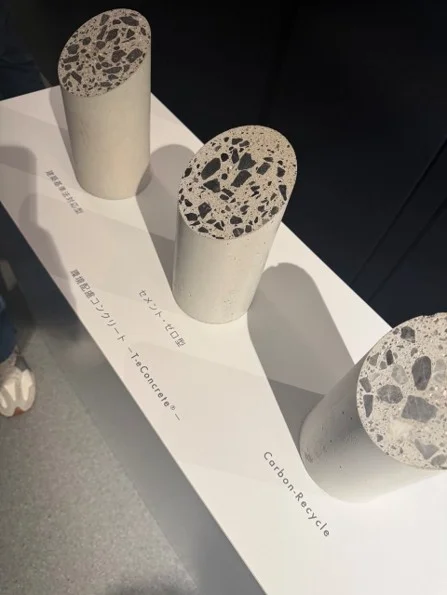
The next direction of technological development is to view CO₂ not only as waste but as a potential raw material. One example is the Japanese T-eConcrete/Carbon-Recycle technology developed by Taisei Corporation. Captured CO₂ reacts with calcium and is converted into calcium carbonate, which is then used in concrete production. Taisei reports that current versions of the technology can fix 98–171 kg of CO₂ per 1 m³ of concrete, while the calculated balance of certain mixes ranges from −116 to −45 kg CO₂/m³. In January 2026, Taisei announced that it had obtained technical verification of the performance of T-eConcrete/Carbon-Recycle for use in precast construction products, demonstrating the technology’s gradual transition from research to broader practical application.
Thus, the technological evolution of the cement industry can be represented as follows:
less energy → less clinker → capture CO₂ → return CO₂ to the material.
Another mandatory system runs through all these stages:
measure → calculate → verify → manage the product’s carbon intensity.
This is precisely why MRV systems are becoming as integral to technological modernization as the kiln, calciner, or power equipment.
9. Financing decarbonization: the CIF program
The technological modernization of cement production requires substantial capital. For developing economies, therefore, the question is not only what technologies exist, but also how their deployment can be financed.
One such mechanism is the Climate Investment Funds (CIF).
CIF has established a dedicated Industry Decarbonization Program focused on reducing emissions in hard-to-abate sectors, including cement, metallurgy, and the chemical industry.
The total program volume is stated as up to USD 1 billion. Its purpose is to use CIF concessional capital to reduce investment risks and mobilize a substantially greater volume of financing from international development banks and private investors. For Uzbekistan, this opportunity has already moved from theory into practice. In 2025, Uzbekistan participated in the international selection process for the CIF Industry Decarbonization program and ranked No. 6 among 26 countries, gaining the opportunity to attract concessional financial resources to reduce industrial emissions. In February 2026, a dedicated three-day CIF mission was held in Tashkent jointly with Uzbekistan’s Ministry of Economy and Finance and the World Bank to discuss the investment program’s areas of focus.
The discussions cover:
-
modernization of industrial production;
-
improving energy efficiency;
-
introducing clean technologies;
-
efficient use of resources;
-
developing decarbonization investment projects.
For the cement industry, this creates a fundamentally new linkage: CBAM creates an economic signal, technologies make it possible to reduce emissions, and CIF can help finance modernization. Preparing an enterprise for decarbonization should therefore begin not with an isolated equipment purchase, but with the development of the project’s investment logic:
baseline emissions → technical measures → volume of CO₂ reduction → CAPEX/OPEX → economic effect → compliance with climate requirements → financing structure.
10. What this means for Uzbekistan’s cement industry
Uzbekistan is in a situation where several factors have coincided at once.
On the one hand, urbanization, infrastructure development, and growing demand for construction materials continue in the country. UNDP specifically notes that the increase in demand for cement in Uzbekistan heightens the importance of decarbonizing the industry. On the other hand, international markets are increasingly taking into account the carbon intensity of industrial products. For a cement producer, this means that competitiveness in the coming years will be determined not only by price, quality, and logistics, but also by the quantity of CO₂ per ton of product and the ability to substantiate that indicator. As a result, Uzbekistan’s cement industry faces several practical tasks:
1. Determine the actual carbon intensity of each enterprise
It is necessary to move from average coefficients to actual data:
-
limestone consumption;
-
clinker factor;
-
types and quantities of fuel;
-
carbon content of raw materials and fuel;
-
electricity consumption;
-
on-site generation;
-
alternative fuel;
-
clinker and cement output by product type.
For actual data to be used under CBAM, they must comply with the established methodology and verification requirements. The European Commission emphasizes that declared actual embedded emissions must be verified by an accredited verifier.
2. Build a decarbonization cost curve
For each enterprise, it is necessary to understand:
which technology → how much it costs → how many tons of CO₂ it reduces → how much carbon cost it avoids.
For example, the economic effect of:
-
reducing the clinker factor;
-
modernizing the kiln;
-
switching to alternative fuels;
-
on-site solar generation;
-
heat recovery;
-
CCS/CCU technologies
can be compared with the cost of maintaining the existing carbon intensity under CBAM.
3. Begin treating carbon as a financial indicator
Until recently, CO₂ emissions were primarily an environmental indicator for most industrial enterprises. CBAM changes this logic. Now: 1 ton of CO₂ × carbon price = financial cost. Consequently, every ton of avoided emissions potentially acquires a measurable economic effect.
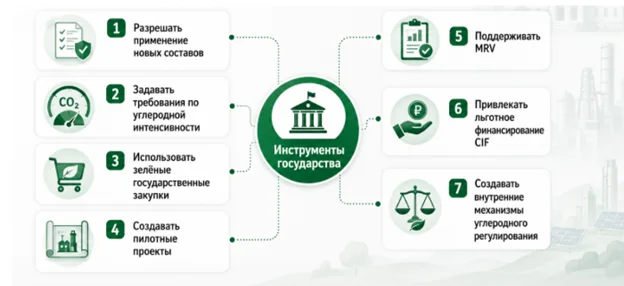
4. Connect industrial policy, standards, and financing
Low-carbon cement cannot be scaled through the producer’s efforts alone.
A system is required that includes:
-
standards permitting the use of new cement compositions;
-
carbon-intensity requirements;
-
an MRV system;
-
green public procurement;
-
demonstration and pilot projects;
-
concessional financing;
-
workforce training;
-
development of a national carbon-regulation system.
It is at the intersection of these instruments that it becomes possible to make decarbonization not an additional burden on the industry, but a mechanism for industrial modernization.
Several circumstances have now converged for Uzbekistan:
-
there is a market — the country needs to continue construction and infrastructure development;
-
there is an economic signal — CBAM and the development of global carbon regulation;
-
there are technologies — from energy efficiency and reducing the clinker factor to LC3, CCS/CCU, and CO₂ mineralization;
-
financing is emerging — including through the CIF Industry Decarbonization program.
The task for the next stage is therefore to connect these four elements in specific investment projects. Decarbonizing the cement industry concerns technological modernization, product cost, access to financing, exports, and the long-term competitiveness of Uzbekistan’s industry. This is why the carbon footprint is gradually becoming a new characteristic of cement — alongside its price, quality, and strength.
Additional information: